Situation Report

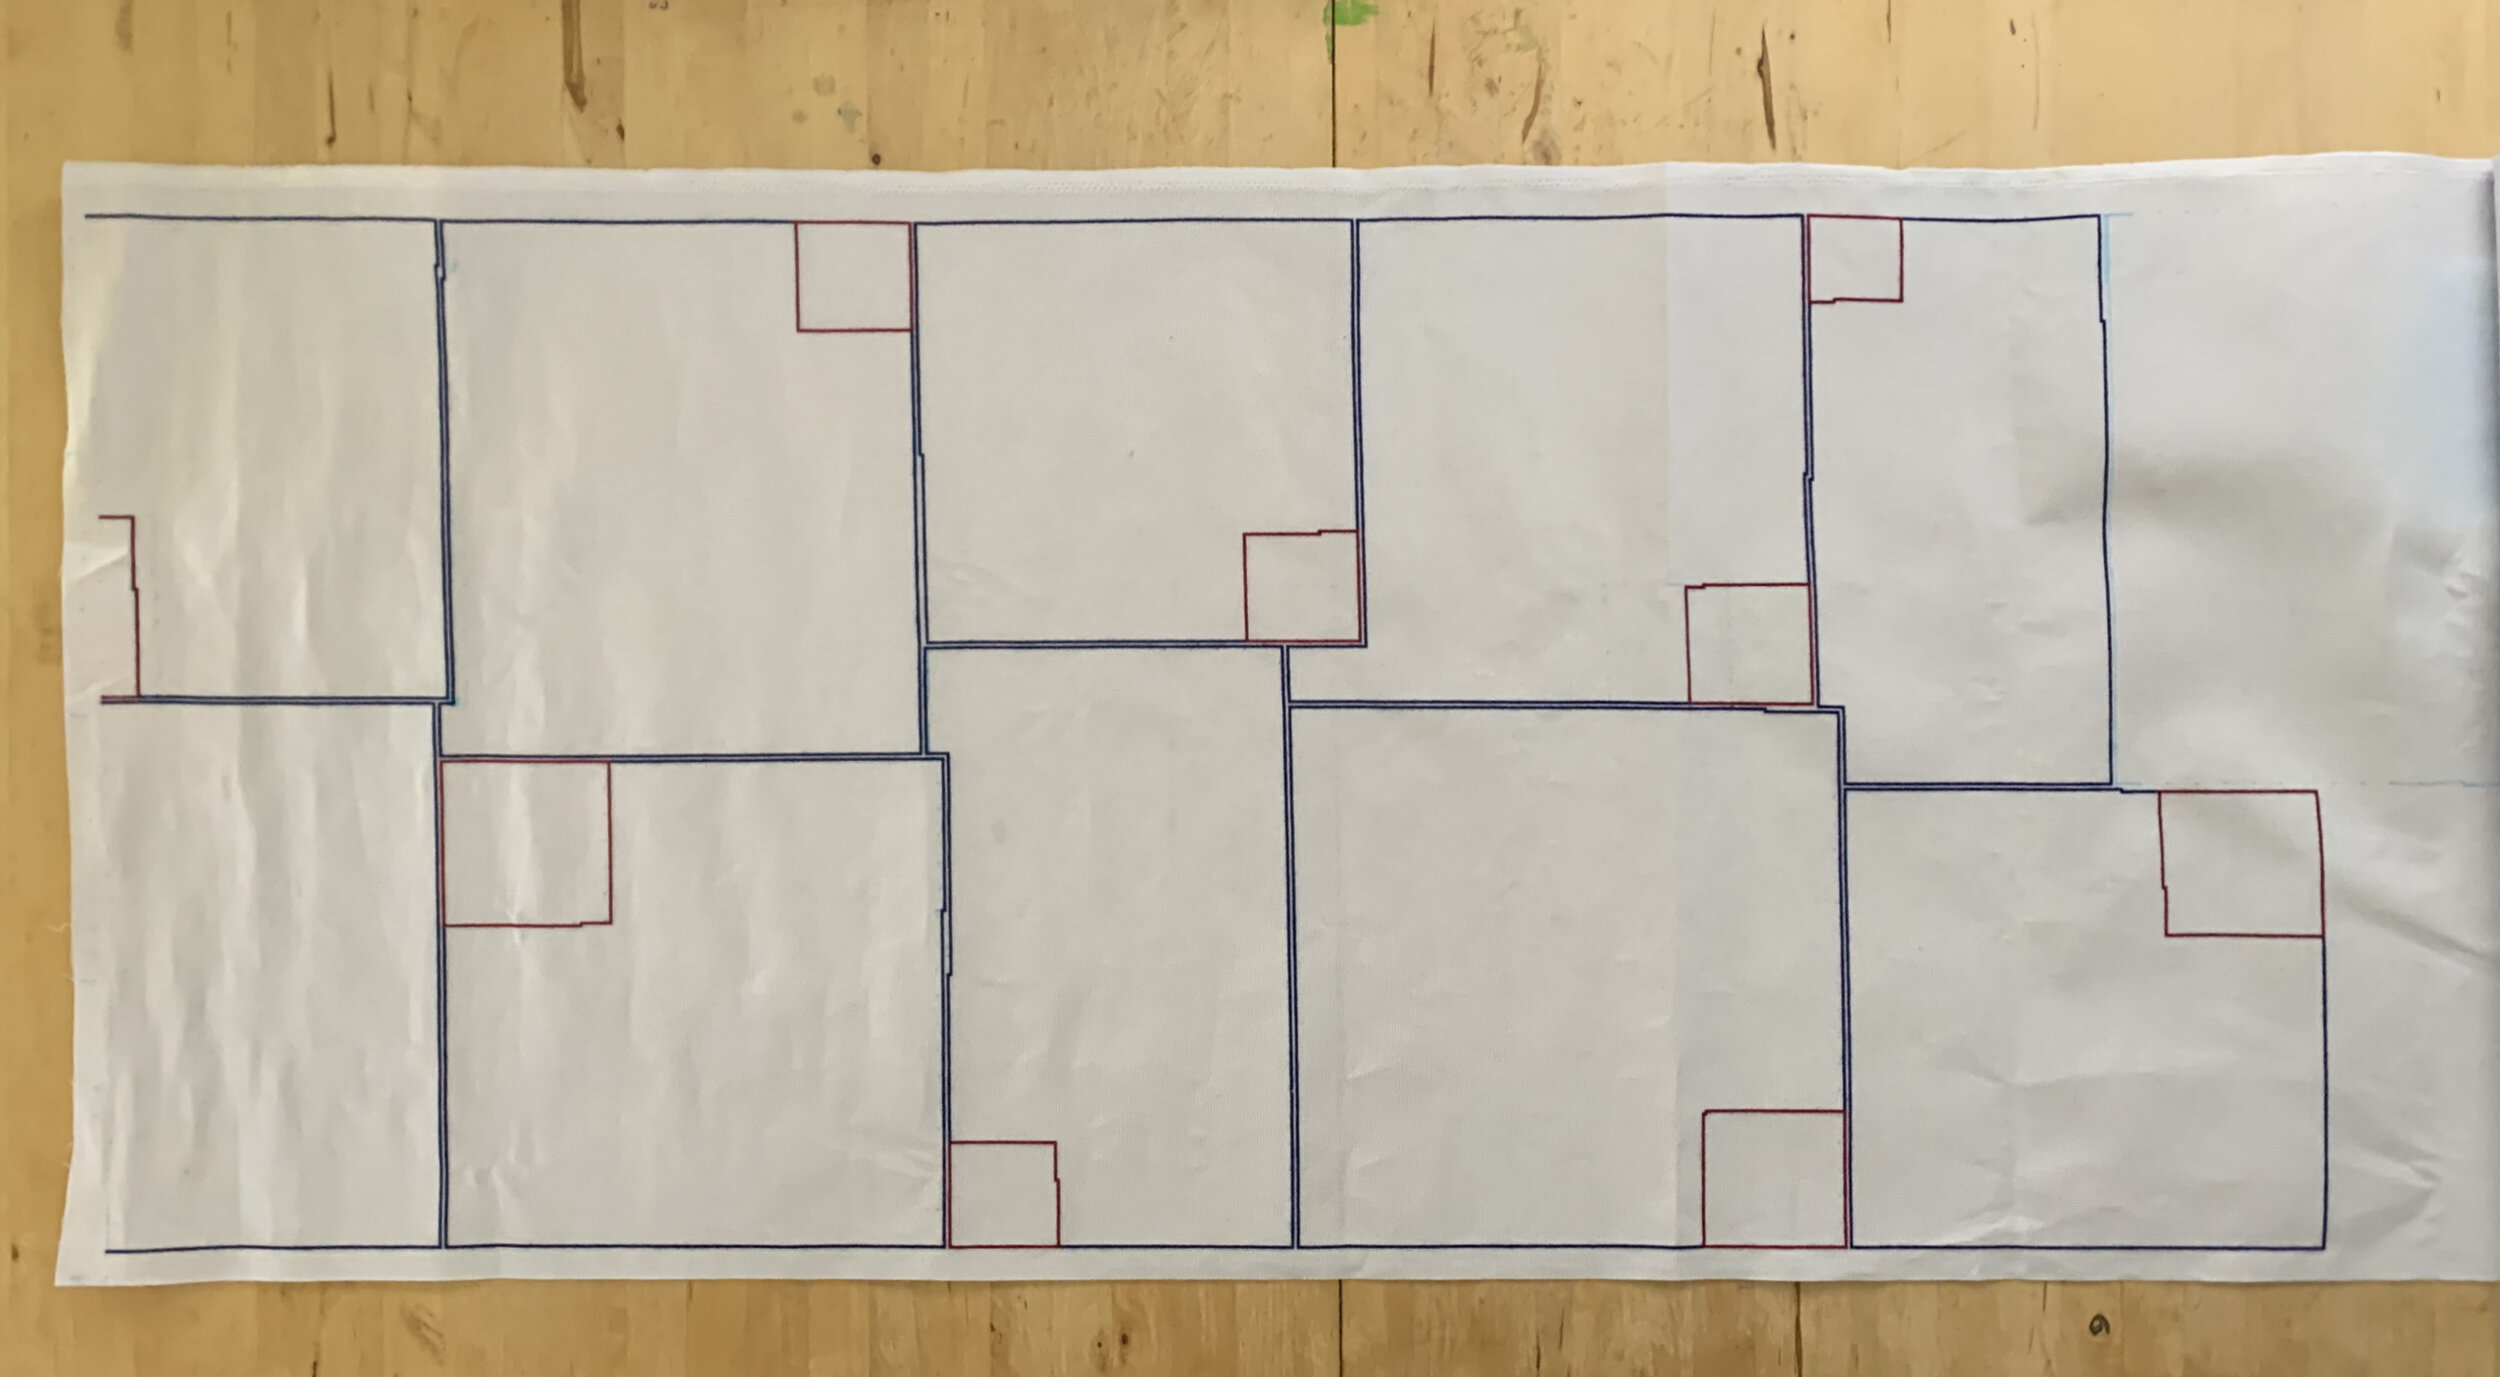
Sections 1, 2 and 3, held up by myself and neighbors. At the time of this photo, the piece measured a little over 25 feet long. Photo by Brad Haynes.
This piece is my chronicle of the COVID-19 epidemic in the United States. Source data is from the WHO’s daily “Situation Reports” from Jan 20 thru March 20. Beginning on March 21st the data is sourced from John’s Hopkins Coronavirus Resource Center. I switched sources because the CDC does not report on the weekends, thus WHO has no numbers for the US on those days.

Me at work in my studio.
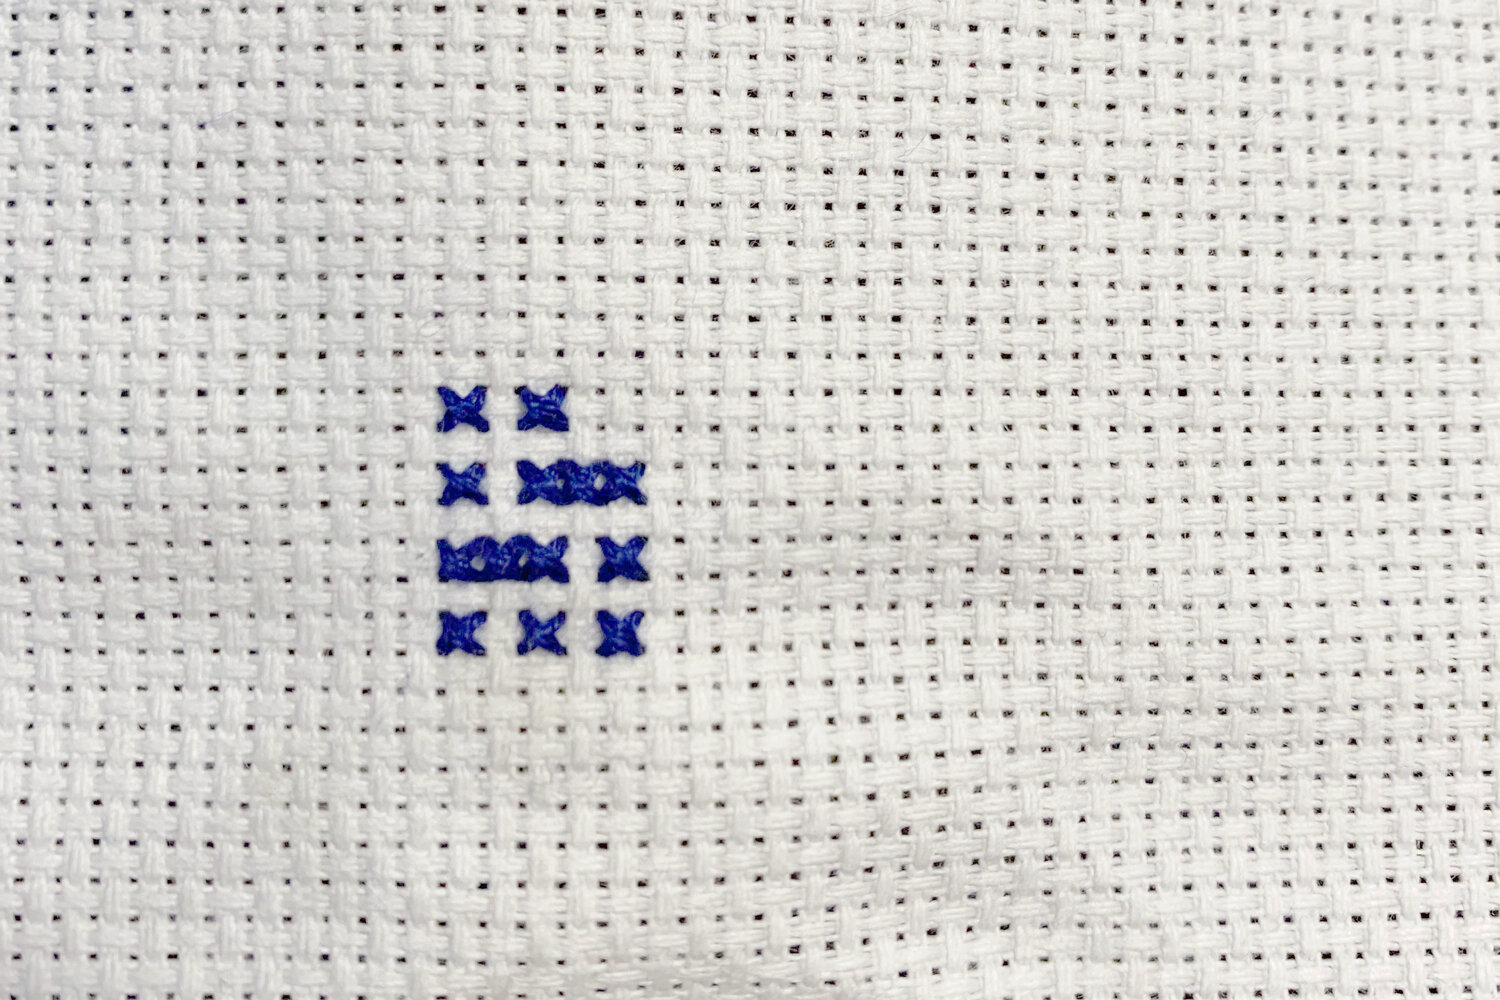
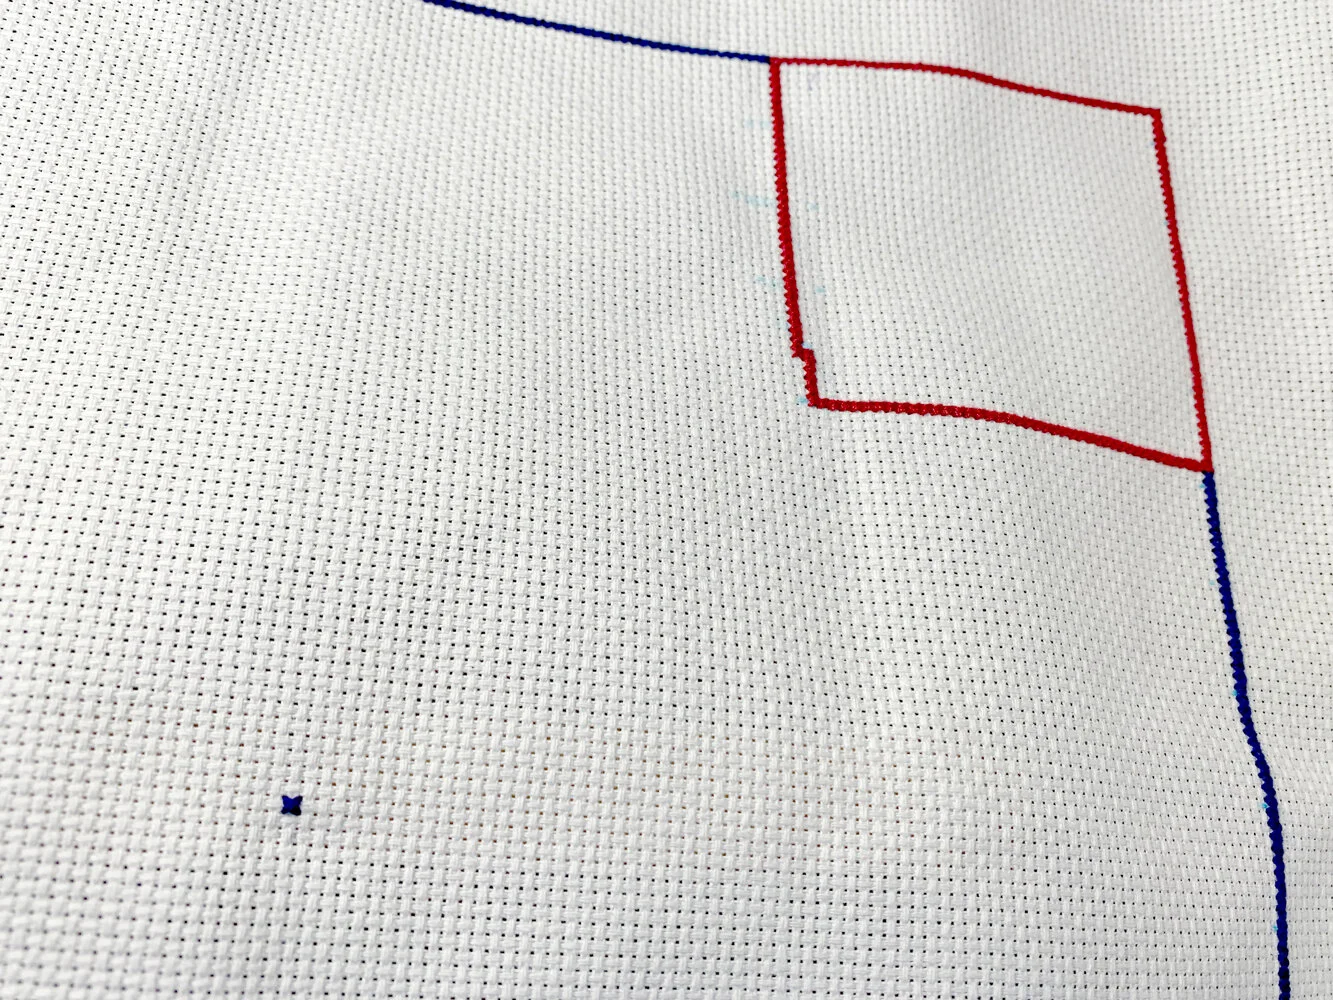
Each blue stitch represents one confirmed case of COVID. Each red stitch represents one death. After March 13 the numbers started rising so fast I could no longer stitch every case in one day, so switched to stitching the outline of area that represents the cases for that day. I continued stitching each death until April 9th, when it became impossible to keep up. I stitched the outlines of case and death counts on a daily basis until June 25, when cases in the US began to rise dramatically. At this point it the piece measured a little shy of 40 feet long, and as the circumference of a circle whose radius is 6’ is about 37.7 feet, it seemed a natural place to stop. I could no longer keep up stitching on my own, so moved on to a second stage.
This new phase involves two approaches. One invites others to stitch with me, in person, to fill in the spaces. In a time when physical touch, even mere proximity, is limited to those with whom we live, it feels essential to plan intentional steps to reconnect with our communities. Stitch work has a long history of communal gathering, affording spaces to not only be with one another, but also share stories. It is my hope that this piece will serve as a safe space to share our experiences of these difficult and devastating times, and find ways to build anew, one stitch at a time, together. I have been stitching with my neighbors since about mid-May, after the first section was done, and will bring it further out into the community when it is appropriate to do so, while respecting social distancing protocols. This in-person stitching is supported with a Creative Neighborhood: COVID-19 Work Project grant from the City of Boulder Office of Arts and Culture in partnership with Create Boulder. My goal is to, over time, come together with my local community and others across Colorado, to fill in the outlines I have already stitched. I will also, when it is safer to travel, bring it when I visit family and friends in other states.
The second approach carries the project forward as COVID-19 continues to plague the US. As of June 26 I have been creating individual stitching kits that are mailed to people all over the US who would like to stitch a block that represents that days’ data. Visit the website, where you can read all about the details regarding how to get involved, sign up to stitch, donate funds (covers supplies, postage, website creation/hosting/maintenance), add your email to receive newsletter updates, and a blog that will feature stories from individual stitchers. You can also follow along on the project’s Instagram page. My goal is to have at least one stitching participant from each state in the US, with demographics that accurately represent those most deeply affected by the virus. Kits are free, with funding supported by private donations (I am actively seeking and applying for grant funding as well), so as to be as accessible as possible to the public. Participants must supply their own thread to complete the interior of the block, and are able to request support to fund thread as well. I deeply desire to represent the actual demographics of the US public as accurately as possible, and am committed to intentionally including historically underrepresented people.
Other opportunities and developments of this ongoing project are possible, and are in the works as we speak, including Spanish translation of all materials (thanks to a grant from the Boulder Arts Commission). If your community or organization is interested in bringing this work to your space, you can contact me here.
This summer I will be part of the Boulder Public Library’s Summer of Discovery programming, as we work together to create a smaller version of this work to reflect local community members’ experiences this past year.
As part of an instructional video series about cross stitch (coming soon!), I created a pattern based on Koko Bayer’s Project Spread Hope. Another work that developed in response to the pandemic, these public installations came to my neighborhood in Boulder in the wake of the horrific mass shooting on March 22nd, 2021. This pattern is available as a free pdf download here.

Working outside with neighbors. Photo by Brad Haynes

Photo by Brad Haynes

Starting the work on the section that represents the day my Uncle Joe died.
My Uncle Joe fell ill and was diagnosed with COVID-19 on April 11. He was hospitalized on April 13th, and died that evening. This piece is dedicated to him.
A note:
The numbers I stitch are sourced from documents via the most consistent resources I have access to and I feel them to be as accurate as is possible. These reports vary over time in which cases are included, and these changes are noted in their reports. At times the WHO reported only lab test confirmed cases, then switched to including clinically diagnosed cases. On March 17th they adjusted the time of the reports to be reported at a consistent time, world wide, which affected the numbers that day. All that to say, I have done my best to be as accurate as possible, but know there will be variation in the documented vs actual cases, as well as possible human error in my own representation of these statistics.
Press:
This project was featured in the Boulder Weekly newspaper.
Denver 7 covered Situation Report on a feature with other artists in Boulder who received a grant from the City of Boulder.
My interview with the City of Boulder Office of Arts and Culture.
The Boulder County Community Foundation featured this project as part of their “Trends Diary” on June 1, 2020. I was also able to record this entry, which aired on KGNU on August 21, 2020.


Abbreviated timeline:
-WHO began its reports on Jan 21, with data from Jan 20. This initial report includes a summary of the events between Dec 31, 2019, when a new kind of “pneumonia” was detected in Wuhan City, China. A total of 44 cases were identified by Jan 3, 2020. On January 7th, this new coronavirus was identified. By the 12th the genetic sequence of the virus was shared with the world so specific diagnostic kits could be mad. As of the first Situation Report, only 282 cases had been identified in four countries, and six people had died.
-On January 11th WHO declared the virus an international public health emergency. The first death due to the virus is reported, a 61-yr-old man in Wuhan, China.
-Jan 21, first case is reported in the US
-Jan 23, Wuhan is placed under quarantine
-Jan 31, US bans entry to anyone having traveled to China in the past 14 days.
-Feb 1, Princess cruises report cases on board two cruise ships.
-Feb 9, fatalities surpass those from the SARS outbreak in 2003.
-Feb 24, US stock exchange begins to plummet.
-Feb 29, US increases travel restrictions to include Iran, Italy and South Korea.
-Feb 29, First death in the US due to the virus, a man in his 50s in Washington state.
-March 6, the first emergency bill is signed to help combat the outbreak in the US. Festivals like SXSW begin cancelling events.
-March 11, WHO classifies this outbreak as a pandemic.
-March 13, our school district closed, transitioning to e-learning after spring break. The president declared a national state of emergency.
-March 15, travel ban for all of Europe.
-March 16, San Francisco is the first city to issue a Stay at Home order. The president advises against gatherings of more than 10 people, avoid restaurants and bars and discretionary travel. First experimental COVID-19 vaccine administered.
-March 18, US-Canada border is closed to non-essential traffic. US refugee admissions suspended. The Families First act is signed into law.
-March 19, California issues a state-wide Stay at Home order.
-March 20, US-Mexico border closes to non-essential traffic. Stock market closes its worst week of performance since 2008. NYC becomes the US epicenter.
-March 22, National Guard is activated to assist WA, CA, and NY.
-March 24, The Olympic Games are postponed to 2021. US cases top 50,000.
-March 26, Colorado issued a mandatory Stay at Home order. Deaths in the US surpass 1,000. US cases surpass China.
-March 27, Global cases surpass 500,000. Economic stimulus bill is signed into law. US cases surpass 100,000, doubling in three days.
-March 28, FDA authorizes a rapid coronavirus test for use. Widespread testing is still limited at best.
-March 29, Social distancing guidelines are extended until April 30 nationwide.
-March 31, NYC death toll surpasses 1,000.
-April 2, as a result of most states’ Stay at Home orders, the US Dept of Labor reports a record 6.6 million filings for unemployment benefits. Deaths in NY surpass 2,000, doubling in 3 days. US cases surpass 50,000, and worldwide cases surpass one million, with over 51,000 deaths worldwide.
-April 3, CDC and White House recommend Americans wear cloth face masks while in public, as medical grade equipment is in extreme short supply. Death toll in US surpasses 7,000, confirmed cases surpass 275,000.
-April 6, US deaths surpass 10,000
-April 9, NYC’s cases surpass 150,000, more than any other country in the world (excepting the US, of course). A grim answer to “America First” BS. Total unemployment claims in the US surpass 16 million. A second vaccine trial begins.
-April 10, the global death toll surpassed 100,000.
-April 11, US death toll becomes highest in the world, surpassing 20,000. Wyoming is the last state to issue a disaster declaration. The day my uncle was diagnosed.
-April 13, NYC’s death toll surpasses 10,000, cases rise over 200,000. Some states, including NYC, start talking about steps toward easing lockdown restrictions. The contrast couldn't be more stark (or, follow the $$). Wyoming reports its first death, the final state to do so. My Uncle Joe died this day.
-April 15, global cases soar over 2 million.
-April 25, World death toll rose to over 200,000.
-April 27, Coronavirus case totals rose to over 3 million.
-April 28, The US has now surpassed a million cases. Over a quarter of them are in New York. Add in the surrounding coastal area from Boston down to DC and you have half the cases in the US.